Risk Table Support & FAQs
You’ll find answers to a number of common questions in the page below. If that’s not sufficient, feel free to use the contact form at the bottom of the page to send a new question.

What is Risk Table?
Risk Table is a MacOS app designed to assist in monitoring and tracking risks associated with small projects or organisations.
Risk Table is designed for smaller organisations such as companies or charities that maintain a risk register and monitor it on a periodic basis.
I have a spreadsheet of risks – why can’t I just use that?The benefit of Risk Table is that it both provides a managed database for risks, similar to a spreadsheet, but also a visualisation of them on on a chart of Impact vs. Likelihood that can also be filtered for specific categories of risk. This can help streamline discussion of risks by focussing attention on those that have changed or are particular damaging or likely.
Can I load my existing spreadsheet risks into Risk Table?
Yes you can, at least for risk fields that match up to the standard Excel template for Risk Table input and a limited number of custom text fields. Download the template, cut & paste your risks into it, then read then into an empty Risk Table new file. Check out the Risk Table Import / Export help page for more instructions. You can also add a database of actions to the table in the same way.
Can I track actions in Risk Table?
Yes – if you are using Normal, Expert or HSSE mode. You can set up a secondary database of actions, where each action is linked to an individual risk. Actions can be review along with risks, or in the dedicated Action Status workflow. Each action can be assigned a due date, and has an associated status flag, where the status of the action is coloured to highlight how it is being progressed relative to its due date. Available statuses are: Ongoing, Behind, Overdue, Paused, Completed and Cancelled. Completed and cancelled risks can be hidden from view using an app settings/preference.
Can I also include Opportunities?
Yes – if you are using Normal or Expert mode, database elements can be classed as a Risk, an Opportunity or as Both. Both table and chart can be filtered to selected only any of these categories.
What’s the best way to use Risk Table?
 Most organisations that track risks perform some sort of periodic review of them e.g. monthly or quarterly. With Risk Table once the database is set up, the cycle of review would typically be that that database owner seeks risks updates from individual risk owners before the regular review. In the review itself, Risk Table is used to highlight significant and/or changed risks, and discussion is focussed on there.
Actions associated with these risks are updated, augmented or created. At the end of the review, the database owner saves the final state as a “reference” set, which then becomes the basis for sharing.
Why are there multiple user modes for Risk Table?
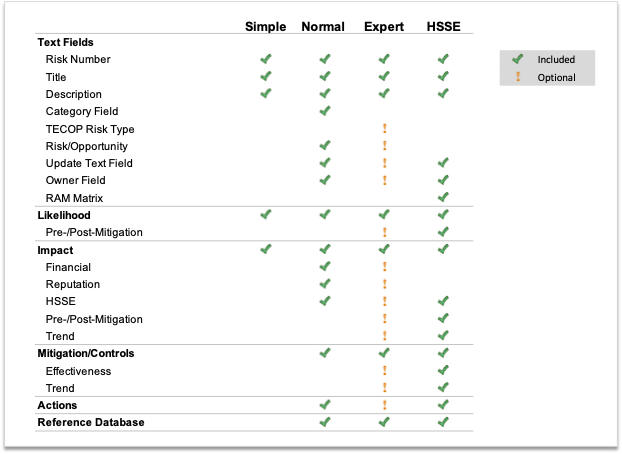
Some organisations may only want a very simple view of risks – Simple mode allows this with effectively just an Impact vs. Likelihood view, and no comparison to post-mitigation values or to past assessments. Many however already score risks separately on Financial and Reputational impact and assess the potential impact on those values of mitigation actions – Expert mode allows this to be included in Risk Table. Normal mode sits in between these two cases. By having multiple modes users can decide the level of complexity best suited to their modus operandi. The table below summarised what is included in each mode:

What is a risk control/mitigation?
Risk controls or mitigations are steps put in place to reduce either the likelihood of a risk happening or the scale of the impact if it does happen (for those familiar with bow-tie diagrams, these are the barriers put in place on either side of the bow-tie). In Normal and Expert mode in Risk Table, risk controls and mitigations can be described in the risk table and also specific actions recorded and tracked in the action table. In Expert mode the effectiveness of the controls can also be assessed and optionally shown graphically around the risk’s icon in the chart view.
What is meant by pre-/post-mitigation impact/likelihood?
One of the purposes of maintaining a risk register is to develop and then track actions on those risks that reduce the likelihood of a risk coming to pass, and/or reduce the impact of the risk coming to pass on the organisation. In Risk Table’s Expert mode both impacts and likelihoods can be assessed as they are and as they are planned/expected to be after identified mitigation actions or controls have been successful. As time passes the actions can be assessed to see if they have achieved their objectives and the impact and/or likelihood has changed as expected.
What are control/impact trends?
In Expert Mode in Risk Table, a directional trend can be assigned to either or both of the controls on a risk or its impact. This assessment can help prioritise discussion of the risks by e.g. focussing on the risks or controls that are negatively trending and expected to get worse to become more likely or more damaging.
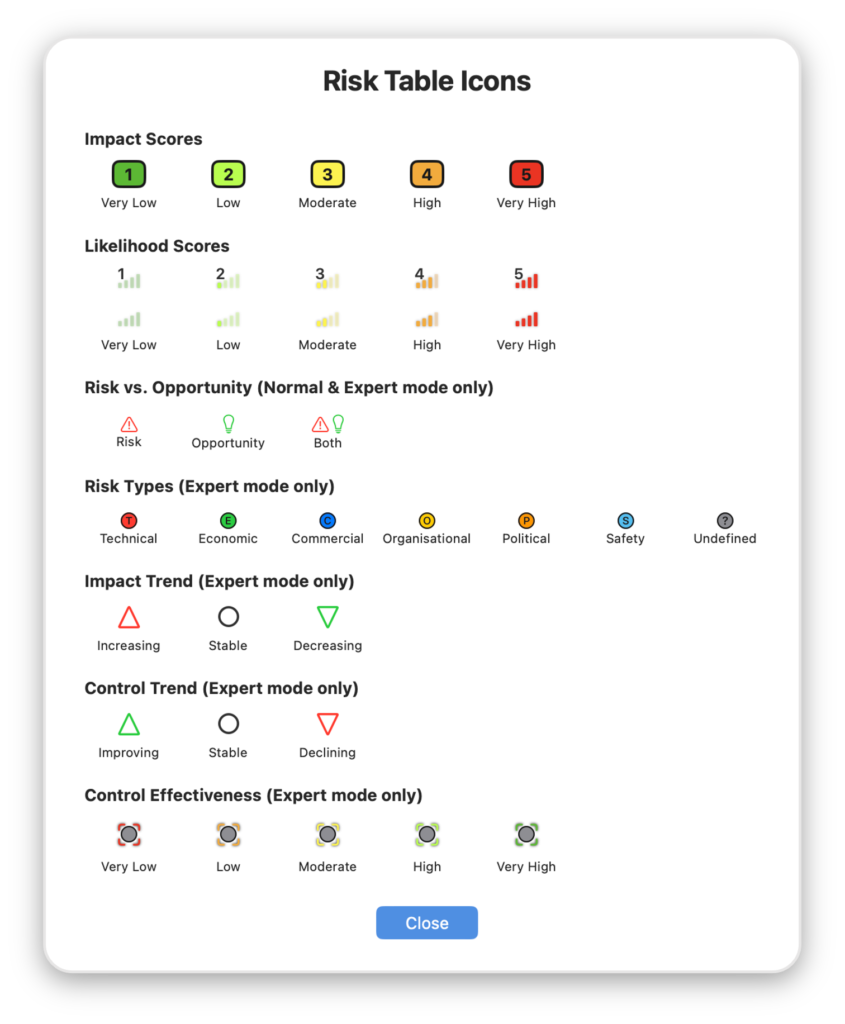
What do the Risk Table icons mean?
The table shows all the icons that appear in Risk Table:
Can I import risks I already have from Excel?
Yes, by cutting & pasting your risks into a pre-defined Excel template that can be read in Risk Table after being saved in Comma Separated Values (.csv) format. See the Import/Export page for more details.
Can I export risks to Excel?
Yes, any Risk Table can be exported to a Comma Separated Values (.csv) file for reading in Excel. If there are actions in the Risk Table, these will also be exported to a separate .csv file. See the Import/Export page for more details.
Can I share my Risk Table?
A Risk Table document is stored on your device as a .risk file. You can share or mail these files like any other file and other Risk Table users will be able to open them.
Can multiple users access Risk Table?
Risk Table is not explicitly designed for simultaneous access by multiple users, but if the .risk file is stored in a shared location e.g. a network drive, the file can be accessed by multiple users.
